Difference between revisions of "Other Naturally Hard Copper Alloys"
Doduco Admin (talk | contribs) (→Copper-Nickel-Tin Alloys) |
(→5.1.5.1 Copper-Nickel Alloys) |
||
| (20 intermediate revisions by 3 users not shown) | |||
| Line 1: | Line 1: | ||
| − | ==== | + | ====5.1.5.1 Copper-Nickel Alloys==== |
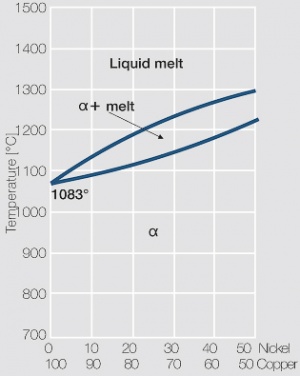
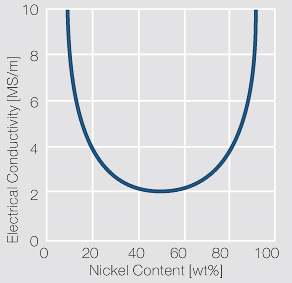
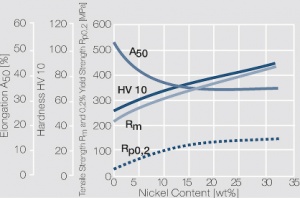
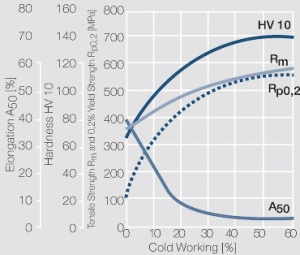
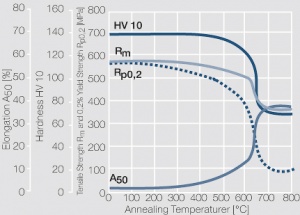
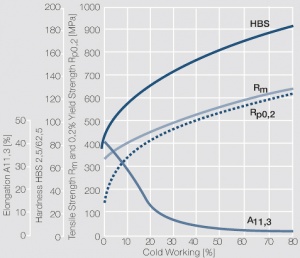
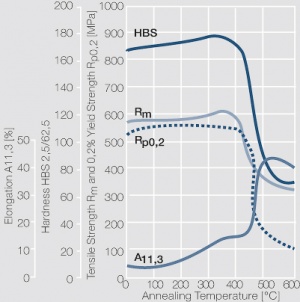
| − | Copper and nickel are in their solid and liquid phase completely soluble in each other | + | Copper and nickel are in their solid and liquid phase completely soluble in each other <xr id="fig:Phase diagram of copper-nickel for the range of 0 – 50 wt% nickel"/> (Fig. 5.21). Because of their very low electrical conductivity they are mainly used as resistance alloys <xr id="fig:Electrical conductivity of copper-nickel alloys as a function of nickel content"/> (Fig. 5.22). The work hardening and softening behavior of CuNi alloys and CuNi9Sn2 are shown in [[#figures6|(Figs. 3 – 7)]] Figs. 5.23 – 5.27. Coppernickel alloys exhibit high corrosion resistance, good weldabilty, and the suitability for cladding to other materials. Because of these and their other properties <xr id="tab:tab5.15"/> (Tab. 5.15) and <xr id="tab:tab5.16"/> (Tab. 5.16) they are, with and without additives of iron or manganese, widely used as good weldable backing layers on weld buttons and weld profiles (weld tapes). |
| − | ==== | + | ====5.1.5.2 Copper-Nickel-Tin Alloys==== |
| − | Copper-Nickel- multi component alloys with 9 wt% Ni and 2 wt% Sn are used mainly as connector materials because of their suitable mechanical properties, their excellent relaxation behavior and their high corrosion resistance. Other advantages include their high temperature stability and the good solderability | + | Copper-Nickel- multi component alloys with 9 wt% Ni and 2 wt% Sn are used mainly as connector materials because of their suitable mechanical properties, their excellent relaxation behavior, and their high corrosion resistance. Other advantages include their high temperature stability and the good solderability even after longer storage. They are also used as base materials for clad profiles and tapes. |
| + | |||
| + | <xr id="fig:Phase diagram of copper-nickel for the range of 0 – 50 wt% nickel"/> Fig. 5.21: Phase diagram of copper-nickel for the range of 0 – 50 wt% nickel | ||
| + | |||
| + | <xr id="fig:Electrical conductivity of copper-nickel alloys as a function of nickel content"/> Fig. 5.22: Electrical conductivity of copper-nickel alloys as a function of nickel content | ||
<div class="multiple-images"> | <div class="multiple-images"> | ||
| − | <figure id="fig: | + | <figure id="fig:Phase diagram of copper-nickel for the range of 0 – 50 wt% nickel"> |
[[File:Phase diagram of copper nickel.jpg|left|thumb|<caption>Phase diagram of copper-nickel for the range of 0 – 50 wt% nickel</caption>]] | [[File:Phase diagram of copper nickel.jpg|left|thumb|<caption>Phase diagram of copper-nickel for the range of 0 – 50 wt% nickel</caption>]] | ||
</figure> | </figure> | ||
| − | <figure id="fig: | + | <figure id="fig:Electrical conductivity of copper-nickel alloys as a function of nickel content"> |
[[File:Electrical conductivity of copper nickel alloys.jpg|left|thumb|<caption>Electrical conductivity of copper-nickel alloys as a function of nickel content</caption>]] | [[File:Electrical conductivity of copper nickel alloys.jpg|left|thumb|<caption>Electrical conductivity of copper-nickel alloys as a function of nickel content</caption>]] | ||
</figure> | </figure> | ||
| Line 20: | Line 24: | ||
| − | <figtable id="tab: | + | |
| − | + | <figtable id="tab:tab5.15"> | |
| + | '''Table 5.15: Physical Properties of Selected Copper-Nickel Alloys''' | ||
{| class="twocolortable" style="text-align: left; font-size: 12px" | {| class="twocolortable" style="text-align: left; font-size: 12px" | ||
| Line 28: | Line 33: | ||
!Composition<br />[wt%] | !Composition<br />[wt%] | ||
!Density<br />[g/cm<sup>3</sup>] | !Density<br />[g/cm<sup>3</sup>] | ||
| − | !colspan="2" style="text-align:center"|Electrical<br />Conductivity | + | !colspan="2" style="text-align:center"|Electrical<br />Conductivity<br />[MS/m] [% IACS] |
!Electrical<br />Resistivity<br />[μΩ·cm] | !Electrical<br />Resistivity<br />[μΩ·cm] | ||
!Thermal<br />Conductivity<br />[W/(m·K)] | !Thermal<br />Conductivity<br />[W/(m·K)] | ||
| Line 36: | Line 41: | ||
!Melting<br />Temp Range<br />[°C] | !Melting<br />Temp Range<br />[°C] | ||
|- | |- | ||
| − | + | |CuAg2<br />not standardized<br /> | |
| − | + | |Ag 2<br />Cu Rest<br /> | |
| − | + | |9.0 | |
| − | + | |49 | |
| − | + | |85 | |
| − | + | |2.0 | |
| − | + | |330 | |
| − | + | |17.5 | |
| − | + | |123 | |
| − | + | |ca. 330 | |
| − | + | |1050 - 1075 | |
|- | |- | ||
| − | | | + | |CuAg2Cd1,5<br />not standardized<br /> |
| − | | | + | |Ag 2<br />Cd1,5<br />Cu Rest |
| − | | | + | |9.0 |
| − | + | |43 | |
| − | | | + | |74 |
| − | + | |2.3 | |
| − | + | |260 | |
| − | + | |17.8 | |
| − | + | |121 | |
| − | + | |ca. 350 | |
| − | + | |970 - 1055 | |
| − | |||
| − | | | ||
| − | | | ||
| − | | | ||
| − | | | ||
| − | |||
| − | |||
| − | |||
| − | |||
| − | | | ||
| − | |ca. | ||
| − | |||
| − | |||
| − | | | ||
| − | |||
| − | |||
| − | |||
| − | |||
| − | |||
| − | |||
| − | |||
| − | |||
| − | |||
| − | |||
|- | |- | ||
| − | | | + | |CuAg6<br />not standardized<br /> |
| − | | | + | |Ag 6<br />Cu Rest |
| − | | | + | |9.2 |
| − | | | + | |38 |
| − | | | + | |66 |
| − | | | + | |2.4 |
| − | | | + | |270 |
| − | | | + | |17.5 |
| − | | | + | |120 |
| | | | ||
| − | | | + | |960 - 1050 |
|} | |} | ||
</figtable> | </figtable> | ||
| Line 100: | Line 81: | ||
| − | <figtable id="tab: | + | <figtable id="tab:tab5.16"> |
| − | + | '''Table 5.16: Mechanical Properties of Selected Copper-Nickel Alloys''' | |
{| class="twocolortable" style="text-align: left; font-size: 12px" | {| class="twocolortable" style="text-align: left; font-size: 12px" | ||
| Line 116: | Line 97: | ||
!Spring Fatigue<br />Limit σ<sub>BW</sub><br />[MPa] | !Spring Fatigue<br />Limit σ<sub>BW</sub><br />[MPa] | ||
|- | |- | ||
| − | | | + | |CuAg2 |
| − | |R | + | |R 280<br />R 380<br />R 450<br />R 550 |
| − | |≥ | + | |280 - 380<br />380 - 460<br />450 - 570<br />≥ 550 |
| − | | | + | |≤ 180<br />≥ 300<br />≥ 420<br />≥ 500 |
| − | |30 | + | |30<br />6<br />3<br />1 |
| − | | | + | |50 - 110<br />100 - 140<br />130 - 165<br />≥ 160 |
| − | | | + | |0 x t<br />0 x t<br />1 x t |
| − | | | + | |0 x t<br />0 x t<br />1 x t |
| − | | | + | |400 |
| − | | | + | |190 |
|- | |- | ||
| − | | | + | |CuAg2Cd1,5 |
| − | |R | + | |R 300<br />R 380<br />R 480<br />R 600 |
| − | | | + | |300 - 380<br />380 - 490<br />480 - 620<br />≥ 600 |
| − | |≤ | + | |≤ 190<br />≥ 310<br />≥ 440<br />≥ 550 |
| − | | | + | |30<br />8<br />3<br />1 |
| − | | | + | |55 - 110<br />100 - 145<br />130 - 170<br />≥ 160 |
| − | | | + | |0 x t<br />0 x t<br />1 x t |
| − | |0 x t<br />0 x t<br /> | + | |0 x t<br />0 x t<br />1 x t |
| − | | | + | |440 |
| − | | | + | |220 |
|- | |- | ||
| − | | | + | |CuAg6 |
| − | |R | + | |R 320<br />R 400<br />R 500<br />R 650 |
| − | |& | + | |320 - 400<br />400 - 510<br />500 - 660<br />≥ 650 |
| − | + | |≤ 210<br />≥ 330<br />≥ 460<br />≥ 610 | |
| − | | | + | |30<br />6<br />3<br />1 |
| − | |70 - 120<br /> | + | |70 - 120<br />110 - 150<br />145 - 175<br />≥ 175 |
| − | + | |0 x t<br />0 x t<br />1 x t | |
| − | + | |0 x t<br />0 x t<br />1 x t | |
| − | + | |460 | |
| − | + | |230 | |
| − | |||
| − | |||
| − | |||
| − | |||
| − | | | ||
| − | | | ||
| − | |||
| − | |||
| − | |||
| − | | | ||
| − | | | ||
|} | |} | ||
</figtable> | </figtable> | ||
<sup>1)</sup> t: Strip thickness max. 0.5 mm | <sup>1)</sup> t: Strip thickness max. 0.5 mm | ||
| − | < | + | <xr id="fig:Strain hardening of copper-nickel alloys as a function of nickel content"/> Fig. 5.23: Strain hardening of copper-nickel alloys as a function of nickel content |
| + | |||
| + | <xr id="fig:Strain hardening of CuNi25 by cold working"/> Fig. 5.24: Strain hardening of CuNi25 by cold working | ||
| + | |||
| + | <xr id="fig:Softening of CuNi25 after 1 hr annealing after 50% cold working"/> Fig. 5.25: Softening of CuNi25 after 1 hr annealing after 50% cold working | ||
| + | |||
| + | <xr id="fig:Strain hardening of CuNi9Sn2 by cold working (Wieland)"/> Fig. 5.26: Strain hardening of CuNi9Sn2 by cold working (Wieland) | ||
| + | |||
| + | <xr id="fig:Softening of CuNi9Sn2 after 1 hr annealing after 60% cold working (Wieland)"/> Fig. 5.27: Softening of CuNi9Sn2 after 1 hr annealing after 60% cold working (Wieland) | ||
| + | |||
| + | <div class="multiple-images"> | ||
<figure id="fig:Strain hardening of copper-nickel alloys as a function of nickel content"> | <figure id="fig:Strain hardening of copper-nickel alloys as a function of nickel content"> | ||
| − | [[File:Strain hardening of copper nickel alloys as function.jpg|left|thumb|<caption>Strain hardening of copper-nickel alloys as a function of nickel content | + | [[File:Strain hardening of copper nickel alloys as function.jpg|left|thumb|<caption>Strain hardening of copper-nickel alloys as a function of nickel content]] |
</figure> | </figure> | ||
| Line 189: | Line 169: | ||
==References== | ==References== | ||
[[Contact Carrier Materials#References|References]] | [[Contact Carrier Materials#References|References]] | ||
| − | |||
| − | |||
Revision as of 13:29, 19 March 2014
5.1.5.1 Copper-Nickel Alloys
Copper and nickel are in their solid and liquid phase completely soluble in each other Figure 1 (Fig. 5.21). Because of their very low electrical conductivity they are mainly used as resistance alloys Figure 2 (Fig. 5.22). The work hardening and softening behavior of CuNi alloys and CuNi9Sn2 are shown in (Figs. 3 – 7) Figs. 5.23 – 5.27. Coppernickel alloys exhibit high corrosion resistance, good weldabilty, and the suitability for cladding to other materials. Because of these and their other properties Table 1 (Tab. 5.15) and Table 2 (Tab. 5.16) they are, with and without additives of iron or manganese, widely used as good weldable backing layers on weld buttons and weld profiles (weld tapes).
5.1.5.2 Copper-Nickel-Tin Alloys
Copper-Nickel- multi component alloys with 9 wt% Ni and 2 wt% Sn are used mainly as connector materials because of their suitable mechanical properties, their excellent relaxation behavior, and their high corrosion resistance. Other advantages include their high temperature stability and the good solderability even after longer storage. They are also used as base materials for clad profiles and tapes.
Figure 1 Fig. 5.21: Phase diagram of copper-nickel for the range of 0 – 50 wt% nickel
Figure 2 Fig. 5.22: Electrical conductivity of copper-nickel alloys as a function of nickel content
| Material Designation EN UNS |
Composition [wt%] |
Density [g/cm3] |
Electrical Conductivity [MS/m] [% IACS] |
Electrical Resistivity [μΩ·cm] |
Thermal Conductivity [W/(m·K)] |
Coeff. of Linear Thermal Expansion [10-6/K] |
Modulus of Elasticity [GPa] |
Softening Temperature (approx. 10% loss in strength) [°C] |
Melting Temp Range [°C] | |
|---|---|---|---|---|---|---|---|---|---|---|
| CuAg2 not standardized |
Ag 2 Cu Rest |
9.0 | 49 | 85 | 2.0 | 330 | 17.5 | 123 | ca. 330 | 1050 - 1075 |
| CuAg2Cd1,5 not standardized |
Ag 2 Cd1,5 Cu Rest |
9.0 | 43 | 74 | 2.3 | 260 | 17.8 | 121 | ca. 350 | 970 - 1055 |
| CuAg6 not standardized |
Ag 6 Cu Rest |
9.2 | 38 | 66 | 2.4 | 270 | 17.5 | 120 | 960 - 1050 | |
| Material | Hardness Condition |
Tensile Strength Rm [MPa] |
0,2% Yield Strength Rp02 [MPa] |
Elongation A50 [%] |
Vickers Hardness HV |
Bend Radius1) perpendicular to rolling direction |
Bend Radius1) parallel to rolling direction |
Spring Bending Limit σFB [MPa] |
Spring Fatigue Limit σBW [MPa] |
|---|---|---|---|---|---|---|---|---|---|
| CuAg2 | R 280 R 380 R 450 R 550 |
280 - 380 380 - 460 450 - 570 ≥ 550 |
≤ 180 ≥ 300 ≥ 420 ≥ 500 |
30 6 3 1 |
50 - 110 100 - 140 130 - 165 ≥ 160 |
0 x t 0 x t 1 x t |
0 x t 0 x t 1 x t |
400 | 190 |
| CuAg2Cd1,5 | R 300 R 380 R 480 R 600 |
300 - 380 380 - 490 480 - 620 ≥ 600 |
≤ 190 ≥ 310 ≥ 440 ≥ 550 |
30 8 3 1 |
55 - 110 100 - 145 130 - 170 ≥ 160 |
0 x t 0 x t 1 x t |
0 x t 0 x t 1 x t |
440 | 220 |
| CuAg6 | R 320 R 400 R 500 R 650 |
320 - 400 400 - 510 500 - 660 ≥ 650 |
≤ 210 ≥ 330 ≥ 460 ≥ 610 |
30 6 3 1 |
70 - 120 110 - 150 145 - 175 ≥ 175 |
0 x t 0 x t 1 x t |
0 x t 0 x t 1 x t |
460 | 230 |
1) t: Strip thickness max. 0.5 mm
Figure 3 Fig. 5.23: Strain hardening of copper-nickel alloys as a function of nickel content
Figure 4 Fig. 5.24: Strain hardening of CuNi25 by cold working
Figure 5 Fig. 5.25: Softening of CuNi25 after 1 hr annealing after 50% cold working
Figure 6 Fig. 5.26: Strain hardening of CuNi9Sn2 by cold working (Wieland)
Figure 7 Fig. 5.27: Softening of CuNi9Sn2 after 1 hr annealing after 60% cold working (Wieland)
