Naturally Hard Copper Alloys
Alloys like brasses (CuZn), tin bronzes (CuSN) and German silver (CuNiZn), for which the required hardness is achieved by cold working, are defined as naturally hard alloys. Included in this group are also the silver bronzes (CuAg) with 2 – 6 wt% of Ag.
Contents
Copper-Zinc Alloys Test (Brasses)
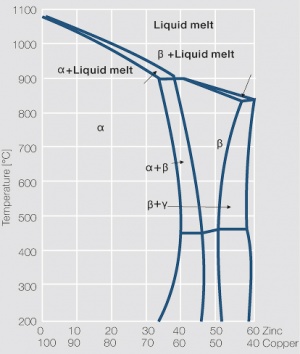
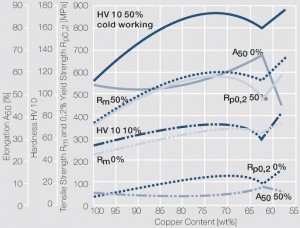
Copper-zinc alloys are widely used as contact carrier materials in switching devices for electrical power engineering because of their high electrical conductivity, the higher mechanical strength combined with good formability compared to pure copper (Table 1 and Table 2), and at the same time their reasonable economic costs. Especially suitable are the brasses with up to 37 wt% Zn content which are according to the phase diagram all made up from the α -phase of the CuZn system (Figure 1). It is important to note the strong dependence of the electrical conductivity and mechanical strength on the zinc content (Figure 2).
| Material/ Designation EN UNS |
Composition [wt%] |
Density [g/cm3] |
Electrical Conductivity |
Electrical Resistivity [μΩ·cm] |
Thermal Conductivity [W/(m·K)] |
Coeff. of Linear Thermal Expansion [10-6/K] |
Modulus of Elasticity [GPa] |
Softening Temperature (approx. 10% loss in strength) [°C] |
Melting Temp Range [°C] | |
|---|---|---|---|---|---|---|---|---|---|---|
| [MS/m] | [% IACS] | |||||||||
| CuZn5 CW500L C21000 |
Cu 94 - 96 Zn Rest |
8.87 | 33 | 57 | 3.8 | 243 | 18.0 | 127 | 1055 - 1065 | |
| CuZn10 CW501L C22000 |
Cu 89 - 91 Zn Rest |
8.79 | 25 | 43 | 4.0 | 184 | 18.2 | 125 | 1030 - 1045 | |
| CuZn15 CW502L C23000 |
Cu 84 - 86 Zn Rest |
8.75 | 21 | 36 | 4.8 | 159 | 18.5 | 122 | ca. 250 | 1005 - 1025 |
| CuZn20 CW503L C24000 |
Cu 79 - 81 Zn Rest |
8.67 | 19 | 33 | 5.3 | 142 | 18.8 | 120 | ca. 240 | 980 - 1000 |
| CuZn30 CW505L C26000 |
Cu 69 - 71 Zn Rest |
8.53 | 16 | 28 | 6.3 | 124 | 19.8 | 114 | ca. 230 | 910 - 940 |
| CuZn37 CW508L C27200 |
Cu 62 - 64 Zn Rest |
8.45 | 15.5 | 27 | 6.5 | 121 | 20.2 | 110 | ca. 220 | 900 - 920 |
| CuZn23Al3Co CW703R C68800 |
Cu 73.5 Al 3.4 Co 0.4 Zn Rest |
8.23 | 9.8 | 17 | 10.2 | 78 | 18.2 | 116 | ca. 280 | 950 - 1000 |
| Material | Hardness Condition |
Tensile Strength Rm [MPa] |
0,2% YieldStrength Rp02 [MPa] |
Elongation A50 [%] |
Vickers Hardness HV |
Bend Radius1) perpendicular to rolling direction |
Bend Radius1) parallel to rolling direction |
Spring Bending Limit σFB [MPa] |
Spring Fatigue Limit σBW [MPa] |
|---|---|---|---|---|---|---|---|---|---|
| CuZn5 | R 230 R 270 R 340 |
230 - 280 270 -350 340 - 440 |
≤ 130 ≥ 200 ≥ 280 |
36 12 4 |
45 - 90 70 - 120 110 - 160 |
0 x t 0 x t |
0 x t 0 x t |
250 | 130 |
| CuZn10 | R 240 R 280 R 350 |
240 - 290 280 - 360 350 - 450 |
≤ 140 ≥ 200 ≥ 290 |
36 13 4 |
50 - 100 80 - 130 110 - 160 |
0 x t 0 x t |
0 x t 0 x t |
260 | 140 |
| CuZn15 | R 300 R 350 R 410 R 480 R 550 |
300 - 370 350 - 420 410 - 490 480 - 560 ≥ 550 |
≤ 150 ≥ 270 ≥ 360 ≥ 420 ≥ 480 |
16 8 3 1 |
85 - 120 100 - 150 125 - 155 150 - 180 ≥ 170 |
0 x t 0 x t 0 x t 1 x t |
0 x t 0 x t 1 x t 3 x t |
300 | 160 |
| CuZn20 | R 270 R 320 R 400 R 480 |
270 - 320 320 - 400 400 - 480 480 - 570 |
≤ 150 ≥ 200 ≥ 320 ≥ 440 |
38 20 5 3 |
55 - 105 95 - 155 120 - 180 ≥ 150 |
0 x t 0 x t 0 x t |
0 x t 0 x t 0 x t |
320 | 180 |
| CuZn30 | R 270 R 350 R 410 R 480 |
270 - 350 350 - 430 410 - 490 480 - 580 |
≤ 160 ≥ 200 ≥ 430 ≥ 430 |
40 21 9 4 |
95 - 125 120 - 155 150 - 180 170 - 200 |
0 x t 0 x t 0 x t 1 x t |
0 x t 1 x t 2 x t 3 x t |
330 | 180 |
| CuZn37 | R 300 R 350 R 410 R 480 R 550 |
300 - 370 350 - 440 410 - 490 480 - 560 550 - 640 |
≤ 180 ≥ 200 ≥ 260 ≥ 430 ≥ 500 |
38 19 8 3 |
55 - 105 95 - 155 120 - 190 ≥ 150 ≥ 170 |
0 x t 0 x t 0 x t 0.5 x t 1 x t |
0 x t 0 x t 0 x t 1 x t 3 x t |
350 | 190 |
| CuZn23Al3Co | R 660 R 740 R 820 |
660 - 750 740 - 830 ≥ 820 |
≥ 580 ≥ 660 ≥ 780 |
10 3 2 |
190 - 220 210 - 240 ≥ 235 |
0 x t 1 x t |
0 x t 2 x t |
≥ 400 | 230 |
1) t: Strip thickness max. 0.5 mm
The main disadvantages of these alloys are with increasing zinc content, the also increasing tendency towards tension crack corrosion and the poorer stress relaxation properties, compared to other copper alloys.
One of the special brass alloys used as a contact carrier material is CuSn23Al3Co. This material exhibits significantly higher mechanical strength than the standard brass alloys. Even so, this material is a naturally hardening alloy, a suitable heat treatment allows to further increase its strength.
Copper-Tin Alloys (Tin Bronze)
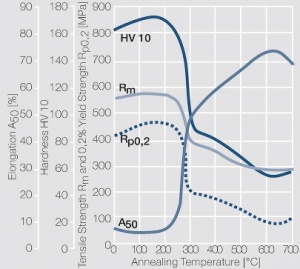
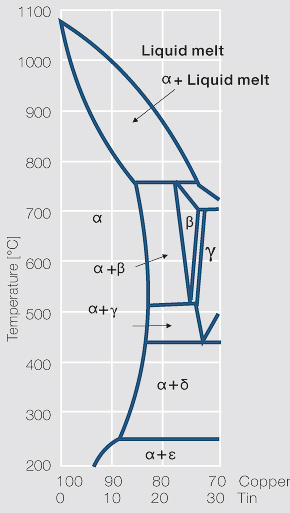
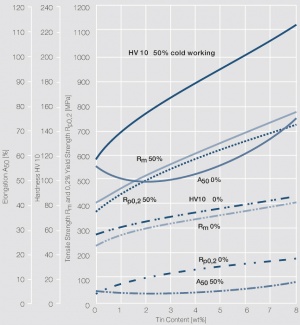
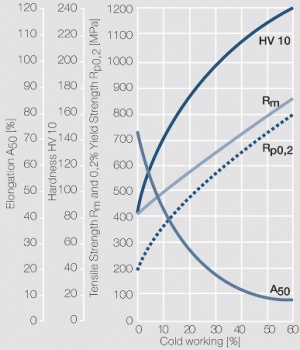
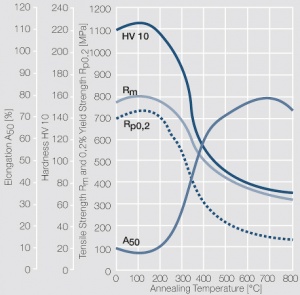
Because of their good elastic spring properties and formability, the copper-tin alloys CuSn6 and CuSn8 are standard materials for spring contact elements in electromechanical components, such as connectors, switches and relays (Table 3 and Table 4). Besides these, other alloys such as CuSn4, CuSn5 and the multi-metal tin bronze CuSn3Zn9 have significant usage – mainly in North America. Figure 6 shows the copper rich side of the phase diagram for the CuSn system. The mechanical property values achieved by cold forming are superior to these of the brass alloys (Figure 7). They increase significantly with increasing Sn content. The work hardening and softening behavior are shown for the example of CuSn8 in Figure 8 and Figure 9. The stress relaxation properties for CuSn alloys are good for up to 100°C, deteriorate however quickly for temperatures above 150°C.
| Material Designation EN UNS |
Composition [wt%] |
Density [g/cm3] |
Electrical Conductivity |
Electrical Resistivity [μΩ·cm] |
Thermal Conductivity [W/(m·K)] |
Coeff. of Linear Thermal Expansion [10-6/K] |
Modulus of Elasticity [GPa] |
Softening Temperature (approx. 10% loss in strength) [°C] |
Melting Temp Range [°C] | |
|---|---|---|---|---|---|---|---|---|---|---|
| [MS/m] | [% IACS] | |||||||||
| CuSn4 CW450K C51100 |
Sn 3.5 - 4.5 P 0.01 - 0.4 Cu Rest |
8.85 | 12.0 | 20 | 8.3 | 118 | 18.0 | 120 | ca. 260 | 960 - 1060 |
| CuSn5 CW451K C51000 |
Sn 4.5 - 5.5 P 0.01 - 0.4 Cu Rest |
8.85 | 10.0 | 17 | 10.0 | 96 | 18.0 | 120 | ca. 260 | 940 - 1050 |
| CuSn6 CW452K C51900 |
Sn 5.5 - 7.0 P 0.01 - 0.4 Cu Rest |
8.80 | 9.0 | 15 | 11.1 | 75 | 18.5 | 118 | ca. 280 | 910 - 1040 |
| CuSn8 CW453K C52100 |
Sn 7.5 - 8.5 P 0.01 - 0.4 Cu Rest |
8.80 | 7.5 | 13 | 13.3 | 67 | 18.5 | 115 | ca. 320 | 875 - 1025 |
| CuSn3Zn9 CW454K C42500 |
Zn 7.5 - 10 Sn 1.5 - 3.5 P 0.2 Ni 0.2 Cu Rest |
8.75 | 12 | 28 | 6.2 | 120 | 18.4 | 126 | ca. 250 | 900 - 1015 |
| Material | Hardness Condition |
Tensile Strength Rm [MPa] |
0,2% Yield Strength Rp02 [MPa] |
Elongation A50 [%] |
Vickers Hardness HV |
Bend Radius1) perpendicular to rolling direction |
Bend Radius1) parallel to rolling direction |
Spring Bending Limit σFB [MPa] |
Spring Fatigue Limit σBW [MPa] |
|---|---|---|---|---|---|---|---|---|---|
| CuSn4 | R 290 R 390 R 480 R 540 R 610 |
290 - 390 390 - 490 480 - 570 540 - 630 ≥ 610 |
≤ 190 ≥ 210 ≥ 420 ≥ 490 ≥ 540 |
40 13 5 4 2 |
70 - 100 115 - 155 150 - 180 170 - 200 ≥ 190 |
0 x t 0 x t 0 x t 0 x t |
0 x t 0 x t 0 x t 1 x t |
420 | 200 |
| CuSn5 | R 310 R 400 R 490 R 550 R 630 R 690 |
310 - 390 400 - 500 490 - 580 550 - 640 630 - 720 ≥ 690 |
≤ 250 ≥ 240 ≥ 430 ≥ 510 ≥ 600 ≥ 670 |
45 17 10 6 3 |
75 - 105 120 - 160 160 - 190 180 - 210 200 - 230 ≥ 220 |
0 x t 0 x t 0 x t 0 x t 1 x t |
0 x t 0 x t 0 x t 1 x t 2 x t |
460 | 220 |
| CuSn6 | R 350 R 420 R 500 R 560 R 640 R 720 |
350 - 420 420 - 520 500 - 590 560 - 650 640 - 730 ≥ 720 |
≤ 300 ≥ 260 ≥ 450 ≥ 500 ≥ 600 ≥ 690 |
45 20 10 7 4 |
80 - 110 125 - 165 160 - 190 180 - 210 200 - 230 ≥ 220 |
0 x t 0 x t 0 x t 0 x t 1 x t |
0 x t 0 x t 0 x t 1 x t 2 x t |
480 | 230 |
| CuSn8 | R 370 R 450 R 540 R 600 R 660 R 740 |
370 - 450 450 - 550 540 - 630 600 - 690 660 - 750 ≥ 740 |
≤ 300 ≥ 280 ≥ 460 ≥ 530 ≥ 620 ≥ 700 |
50 23 15 7 4 |
90 - 120 135 - 175 170 - 200 190 - 220 210 - 240 ≥ 230 |
0 x t 0 x t 0 x t 1 x t 2 x t |
0 x t 0 x t 0 x t 1 x t 2 x t |
520 | 240 |
| CuSn3Zn9 | R 320 R 380 R 430 R 510 R 580 R 660 |
320 - 380 380 - 430 430 - 520 510 - 600 580 - 690 ≥ 660 |
≤ 230 ≥ 200 ≥ 330 ≥ 430 ≥ 520 ≥ 610 |
25 18 6 3 4 |
80 - 110 110 - 140 140 - 170 160 - 190 180 - 210 ≥ 200 |
0 x t 0 x t 0 x t 0 x t 1 x t |
0 x t 0 x t 0 x t 1 x t 2 x t |
500 | 210 |
1) t: Strip thickness max. 0.5 mm
Copper-Nickel-Zinc Alloys (German Silver)
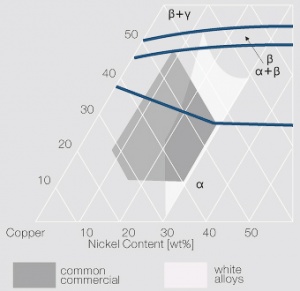
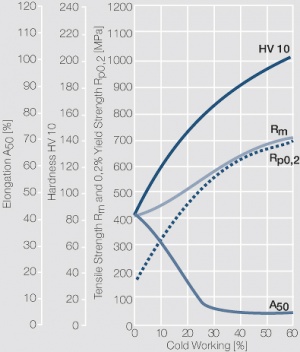
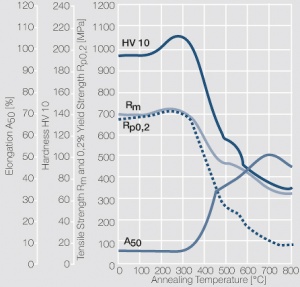
Despite its lower electrical conductivity, the good spring properties, high corrosion resistance and the good workability make copper-nickel-zinc alloys a frequently used spring contact carrier in switches and relays. As illustrated in the phase diagram, the most commonly used materials are in the α -range which means that they are single-phase alloys (Figure 10). The formability and strength properties of german silver are comparable to those of the copper-tin alloys. The work hardening and softening behavior is illustrated on the example of CuNi12Zn24 in Figure 11 and Figure 12.
The relaxation behavior of Cu-Ni-Zn alloys is superior to the one for the tin bronzes. Additional advantages are the very good weldability, brazing properties and the high corrosion resistance of these copper-nickel-zinc alloys.
| Material Designation EN UNS |
Composition [wt%] |
Density [g/cm3] |
Electrical Conductivity |
Electrical Resistivity [μΩ·cm] |
Thermal Conductivity [W/(m·K)] |
Coeff. of Linear Thermal Expansion [10-6/K] |
Modulus of Elasticity [GPa] |
Softening Temperature (approx. 10% loss in strength) [°C] |
Melting Temp Range [°C] | |
|---|---|---|---|---|---|---|---|---|---|---|
| [MS/m] | [% IACS] | |||||||||
| CuNi12Zn24 CW403J C75700 |
Cu 63- 66 Ni 11 - 13 Mn 0.5 Fe 0.3 Zn Rest |
8.67 | 4.4 | 7 | 30 | 42 | 18 | 125 | ca. 400 | 1020 - 1065 |
| CuNi18Zn20 CW409J C76400 |
Cu 60 - 63 Ni 17 - 19 Mn 0.5 Fe 0.3 Zn Rest |
8.73 | 3.3 | 5 | 23 | 33 | 17.7 | 135 | ca. 440 | 1055 - 1105 |
| CuNi18Zn27 CW410J C77000 |
Cu 53 - 56 Ni 17 - 19 Mn 0.5 Fe 0.3 Zn Rest |
8.70 | 3.3 | 5 | 23 | 32 | 17.7 | 135 | ca. 440 | 1050 - 1100 |
| Material | Hardness Condition |
Tensile Strength Rm [MPa] |
0,2% Yield Strength Rp02 [MPa] |
Elongation A50 [%] |
Vickers Hardness HV |
Bend Radius1) perpendicular to rolling direction |
Bend Radius1) parallel to rolling direction |
Spring Bending Limit σFB [MPa] |
Spring Fatigue Limit σBW [MPa] |
|---|---|---|---|---|---|---|---|---|---|
| CuNi12Zn24 | R 360 R 430 R 490 R 550 R ≥ 610 |
360 - 430 430 - 510 490 - 580 550 - 640 ≥ 580 |
≤ 230 ≥ 230 ≥ 400 ≥ 480 ≥ 580 |
35 8 6 3 2 |
80 - 110 110 - 150 150 - 180 170 - 200 ≥ 190 |
0 x t 0 x t 0 x t 0 x t |
0 x t 0 x t 0 x t 0 x t |
480 | 210 |
| CuNi18Zn20 | R 380 R 450 R 500 R 580 R ≥ 640 |
380 - 450 450 - 520 500 - 590 580 - 670 ≥ 640 |
≤ 250 ≥ 250 ≥ 410 ≥ 510 ≥ 600 |
27 9 5 2 |
85 - 115 115 - 160 160 - 190 180 - 210 ≥ 220 |
0 x t 0 x t 0 x t 0 x t |
0 x t 0 x t 0 x t 0 x t |
520 | 220 |
| CuNi18Zn27 | R 390 R 470 R 540 R 600 R ≥ 700 |
390 - 470 470 - 540 540 - 630 600 - 700 ≥ 700 |
≤ 280 ≥ 280 ≥ 450 ≥ 550 ≥ 680 |
30 11 5 2 |
90 - 120 120 - 170 170 - 200 190 - 220 ≥ 220 |
0 x t 0 x t 0 x t 0 x t |
0 x t 0 x t 0 x t 1 x t |
550 | 250 |
1) t: Strip thickness max. 0.5 mm
Copper-Silver-(Cadmium) Alloys (Silver Bronze)
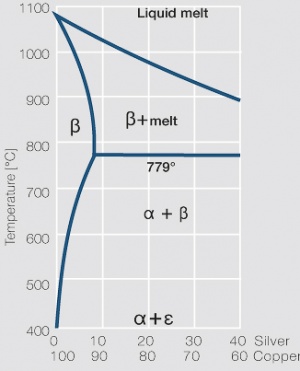
Besides the low-allowed CuAg0.1, other copper materials with higher silver contents (2-6 wt%) are also used as contacts carrier materials. Some of them contain additional 1.5 wt% Cd. The phase diagram Figure 13 shows that in principle the CuAg alloys can be precipitation hardened, but the possible increase in mechanical strength is rather small.
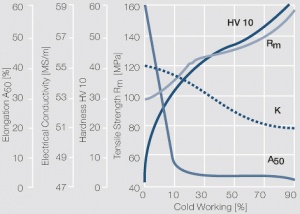
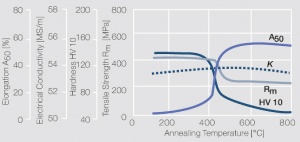
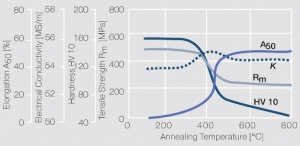
Copper-silver alloys have good spring properties and compared to other spring materials have a high electrical conductivity (Table 7 and Table 8). The mechanical strength values in the strongly worked condition are comparable to those of the copper-tin alloys. Work hardening and softening behavior are shown for the example of CuAg2 (Figs. 13 – 15). For the relaxation behavior, the silver bronzes are superior to German silver and tin bronze.
Because of their good spring properties combined with high electrical conductivity, silver bronzes are suitable for the use contact springs in relays under higher current loads. Taking advantage of their high temperature stability, they are also used as current carrying contacts in high voltage switchgear and as electrode material for resistance welding.
| Material Designation EN UNS |
Composition [wt%] |
Density [g/cm3] |
Electrical Conductivity |
Electrical Resistivity [μΩ·cm] |
Thermal Conductivity [W/(m·K)] |
Coeff. of Linear Thermal Expansion [10-6/K] |
Modulus of Elasticity [GPa] |
Softening Temperature (approx. 10% loss in strength) [°C] |
Melting Temp Range [°C] | |
|---|---|---|---|---|---|---|---|---|---|---|
| [MS/m] | [% IACS] | |||||||||
| CuAg2 not standardized |
Ag 2 Cu Rest |
9.0 | 49 | 85 | 2.0 | 330 | 17.5 | 123 | ca. 330 | 1050 - 1075 |
| CuAg2Cd1,5 not standardized |
Ag 2 Cd1,5 Cu Rest |
9.0 | 43 | 74 | 2.3 | 260 | 17.8 | 121 | ca. 350 | 970 - 1055 |
| CuAg6 not standardized |
Ag 6 Cu Rest |
9.2 | 38 | 66 | 2.4 | 270 | 17.5 | 120 | 960 - 1050 | |
| Material | Hardness Condition |
Tensile Strength Rm [MPa] |
0,2% Yield Strength Rp02 [MPa] |
Elongation A50 [%] |
Vickers Hardness HV |
Bend Radius1) perpendicular to rolling direction |
Bend Radius1) parallel to rolling direction |
Spring Bending Limit σFB [MPa] |
Spring Fatigue Limit σBW [MPa] |
|---|---|---|---|---|---|---|---|---|---|
| CuAg2 | R 280 R 380 R 450 R 550 |
280 - 380 380 - 460 450 - 570 ≥ 550 |
≤ 180 ≥ 300 ≥ 420 ≥ 500 |
30 6 3 1 |
50 - 110 100 - 140 130 - 165 ≥ 160 |
0 x t 0 x t 1 x t |
0 x t 0 x t 1 x t |
400 | 190 |
| CuAg2Cd1,5 | R 300 R 380 R 480 R 600 |
300 - 380 380 - 490 480 - 620 ≥ 600 |
≤ 190 ≥ 310 ≥ 440 ≥ 550 |
30 8 3 1 |
55 - 110 100 - 145 130 - 170 ≥ 160 |
0 x t 0 x t 1 x t |
0 x t 0 x t 1 x t |
440 | 220 |
| CuAg6 | R 320 R 400 R 500 R 650 |
320 - 400 400 - 510 500 - 660 ≥ 650 |
≤ 210 ≥ 330 ≥ 460 ≥ 610 |
30 6 3 1 |
70 - 120 110 - 150 145 - 175 ≥ 175 |
0 x t 0 x t 1 x t |
0 x t 0 x t 1 x t |
460 | 230 |
1) t: Strip thickness max. 0.5 mm
